What is process mapping?
Process mapping your value stream is all about detailing the specific actions that are taken throughout your entire process or a specific portion of your processes. There are a number of process mapping tools that you can use to map your business, some of the most useful ones I will detail below.
In this article I am going to talk about;
- Value Stream Mapping (VSM)
- Flow Charting
- String Diagrams / Spaghetti Diagrams
- Brown Paper Exercise
Why do we need process mapping
Process mapping is one of the top level tools of Lean manufacturing, by this I mean it is a tool that identifies the areas and steps required for improvement within the organization by using the other tools of lean manufacturing.
By using the various mapping tools that are available you can identify the various process steps that either add value or cost you money within your company. However a tool that just highlights the areas for improvement is useless unless you follow through by actually making the improvements, far to often companies invest energy into creating current state maps and fail to follow through and generate improvements.
Another problem that companies often have is that of taking action without a clearly defined future state that they wish to achieve, this is like the usual analogy of the rowing or tug of war team all pulling in different directions! A future state map provides you with this clear vision that you need to achieve and provides the team with direction.
What is the value stream
The value stream is the processes that your product has to go through from raw materials to delivery to the customer. During this journey your product will go through a number of steps, some of which add value and others that add no value or leave your product sat waiting sometimes for weeks at a time. When mapping the value stream we seek to identify those value adding and non-value adding steps and delays to allow us to eliminate or at least reduce those steps that cost us money and increase our lead times.
Within lean manufacturing we are trying to reduce the lead time from order receipt through to cash, by reducing this time frame we can reduce the time that our cash is tied up in stock and work in progress and increase the time it available to us to use it!
If you remember your lean principles you will know that the second principle is to identify the value stream, and the third is to make that value flow by removing obstacles and delays, process mapping tools are what you need to identify your process flow to enable improvements to be made.
Types of Process mapping
Depending on the scope and purpose of our mapping exercise there are a number of different mapping tools that we can use But before we begin any mapping exercise we must be clear about what it is exactly that we are mapping, we must set the system boundaries for our map; be that an individual work-cell or the whole supply chain. Some tools such as Value Stream Mapping are very good tools for seeing the whole process but are not detailed enough to analyze a specific process which may require the detail of a process flow diagram or a string diagram to show how product flows through an area,
VSM
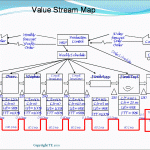
Value Stream Mapping or VSM is a very useful top level view of your company’s processes from supplier through to the customer. It shows the flow of product as well as information flow internally and externally.
The value stream map also shows stock levels, manning, process times and other useful pieces of information that can be used to analyze your overall process flow. It is typical when you generate your company’s initial current state value stream map to find that your product has value added to it within your processes for only a fraction of one percent of the time that it is within your company.
The VSM shows very clearly your potential opportunity to reduce lead times and stock holding and can often be a shock to many members of the management team.
Value stream mapping is usually conducted with a team that comprises the people within the areas being mapped, where multiple products are produced by a company it is important to choose the correct product or family of products to map. This means either choosing the most important or the one that would be the easiest to improve depending on the needs of the business. Often there is a need to do product family analysis as there are many variants and processes involved.
The current state map should reflect reality, data should be gathered at the gemba (where the work is done), not based on written procedures.
Once the current state map is complete it is time to move towards a future state map, this is a map of where you wish to get to within a fixed time frame. You may also have an ideal state map in mind to which your iterations of future state maps and action plans should eventually lead!
Seeing the Whole VSM
The standard value stream map usually maps the process for one company from supplier to customer, a seeing the whole map is very similar but seeks to map the whole of the value stream from raw materials through to the final customer via the entire value stream.
The process is the same but where you would have boxes for individual processes in the value stream map you would have companies!
Flowcharting
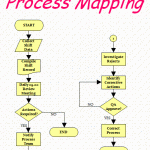
Flow charting is a simple charting process to highlight individual steps within a specific process such as order entry, it is usually applied to a specific sub process rather than the whole value stream as in VSM above.
Flowcharting is a very useful and easy way to highlight value adding and non value adding steps within a process, it also can often give you a clear standardized process flow document to use as the standard for working when you have made your improvements.
String Diagram or Spaghetti diagrams
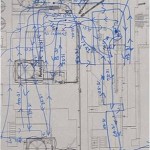
The string diagram or spaghetti diagram as it often resembles a plate of said food thrown into your workplace is a visual representation of your workflow drawn onto a diagram of your shop floor processes. It shows how far operators, information and products have to travel during your processes, often traveling huge distances and doubling back on itself many times.
This is a very powerful and useful mapping tool for improvement and is often neglected because of its simplicity. My colleagues and myself once did this exercise for a ground to air missile and found that the missile traveled further in manufacture than it could travel when fired.
Brown paper Exercise
A brown paper exercise is a combination of many mapping tools, a cross between, flowcharting and spaghetti diagram it is produced on a large piece of brown wrapping paper but often now using a roll of white paper but the name has stuck. It is usually stuck to the wall in a “war room” where everyone can add to it and discuss it.
It usually covers all the aspects of a specific process flow, you may find yourself sticking forms, printouts, post its and other relevant information to show the entire flow and its complexity. The shock value of this exercise can be very valuable, when someone sees just how many steps and the number of people and forms that are involved in a “simple” process they are often banging the table to see things simplified.


