This is a step by step guide to creating a current state value stream map, the first step in working towards your ideal state value stream and a truly lean system. Your current state value stream map is a team effort that is conducted by those people who are involved in the process, at the actual process, not by an expert locked in a room with a pile of procedures.
Below we will go through;
- Selecting the product (family) to map
- VSM Symbols
- Defining the process boundaries
- The Process Steps
- Information Flows
- Process Data
- Calculating the Time Line
- Multiple Suppliers and Customers
- Interpreting the Data
- Next Steps (Ideal and future state maps)
You can also download a free Value Stream Mapping presentation in PPT and PDF format that goes with this page:
How to Value Stream Map Presentation PPT Download
How to VSM presentation PDF Download
What is Value Stream Mapping (VSM)
Your Value stream map is a representation of the flow of materials from supplier to customer through your organization as well as the flow of information. This enables you to see at a glance where the delays are in your process, any restraints and excessive inventory. Your current state map is the first step in working towards your ideal state for your organization.
How to create a VSM
Value stream mapping (VSM) is a team exercise and should involve representatives from all of the areas within the process being mapped, this process should be facilitated and led by an expert with experience in creating value stream maps. A value stream map is best created by hand using a pencil (you will need to make frequent corrections and changes) on a sheet of A3 paper. It is better to create by hand and involve the entire team in its creation rather than have an expert take the information and return later with a finished map!
Step by step guide to Value Stream Mapping;
Select the product or product family
Firstly we need to decide what it is exactly that we wish to map, in a company with many products there may have to be some initial work done to identify which product or family group of products that should be mapped, we may decide to go with highest volume or value, or take a longer term strategic look at those product ranges that we expect to do more business with in the future or we may be guided by our customers as to what to map.
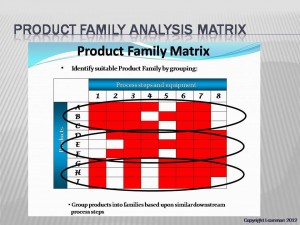
If we have a plethora of products we may wish to first conduct a product family analysis, this is a simple review of our products and which processes they go through. It may not be necessary to analyze all products, use a Pareto analysis to decide which products you need to analyze (either through volume or value or a combination.) This analysis can help us group together products that share common routing through our processes. Our value stream map can then concentrate on either a single product or a family of them sharing common processes.
Value Stream Mapping Symbols
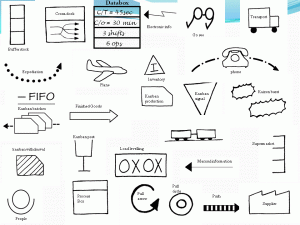
The picture to the Left shows some of the commonly used value stream mapping symbols and their meanings. It is not necessary to use these specific symbols, if you have symbols that are more relevant / descriptive for your processes then use those.
Bound the Process
We need to decide the limits of our map, most value stream maps are conducted from supplier through to customer within an organization and these should be the first boxes placed on your VSM to bound the process. It is possible to map the entire supply chain, in this case the start and end points for your process map would be the raw materials and the final consumer, instead of putting boxes for process steps thereafter however you would use companies.
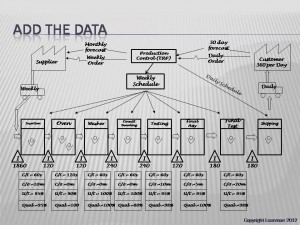
Process steps
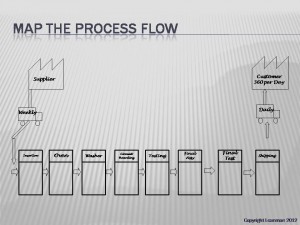
Once you have your process boundaries established you need to define your process steps for your map, some people advocate walking the process from customer back to supplier or the other way around, quite frankly it does not matter too much which way you do it.
The process steps are the various operations that are performed on the product, these are generally located in a single place with one point that inventory enters and then leaves. We are not breaking down each operation into specific tasks, there are other process mapping techniques such as flow charting that would be a better tool for analyzing to that level of detail.
Add Information Flows to your Value Stream Map
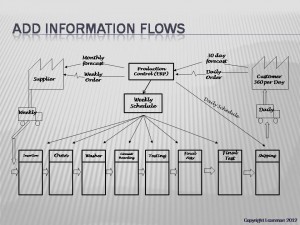
One of the things that differentiates a VSM from most other mapping tools is the inclusion of the information flows into the map. We need to include how the customers order product, frequency and method, and how we translate that back to our supplier. We also include how we then communicate requirements to our processes to ensure that we produce what the customer wants.
Collect Process Data
This where we need to do a little thinking and some work, get the team to collect data regarding the performance of each step of the process; typical types of date to collect are;
- Inventory
- Cycle time (time taken to make one product)
- Change over time (from last good piece to next)
- Up-time (on-demand machine utilization)
- Number of operators
- Shifts worked
- Net available working time
- Scrap rate
- Pack size/pallet sizes
- Batch Size
Select the relevant measures for your process and record actual data at the workplace, try to avoid “historical” measures where possible, get your own current information. If you do use timings and other data from the “system” to save time make a note of those measures and ensure that you go back and verify them during the action phase. Record this data in the “data boxes” on your Value Stream Map
Inventory
Inventory and overproduction are two of the biggest of the seven wastes of lean and tend to occur when we have problems in our production processes. We use excess inventory to cushion ourselves against process problems so careful note should be taken of inventory build up. When counting inventory for your map question carefully as it is not unusual to find pallets of inventory stored in odd locations due to previous problems or as a contingency.
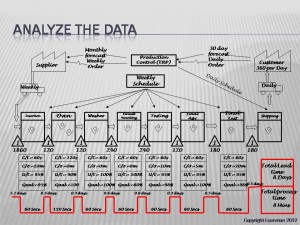
Time Line
We create the time line to give us information about total process times and lead times for inventory through our processes; we use the inventory at each stage and the daily demand to calculate the amount of stock in days and add this to the top of the time line, this will allow us to calculate a total lead time. The cycle time for one product is then placed in the lower portion and this will be added to give a total processing time.
It is usual to at this point to have lead times that are several days to several weeks and processing times that are are only a few minutes which highlights just how much waste there is in our system.
This gives us our completed current state value stream map; now the real work can start.
Multiple Suppliers and Customers in VSM
The map produced above is a fairly simple map with just one customer and one supplier, more often than not we have multiple suppliers and customers and it may be necessary to draw on more than one. In this case the process is still the same but when you calculate your timeline use the worst case for inventory. If you have many suppliers it may be worth concentrating on your most important suppliers or grouping them into similar types such as fasteners.
More often than not you can still show multiple customers as one, or if required as groups with similar requirements such as weekly or monthly demands.
Interpreting the Value Stream Map
The data boxes and the timeline contain much information about our process, you can now see in one document where the problem areas within your process lie, issues such as;
- Excessive Inventory
- Long cycle times
- Low uptime
- Excessive Setup Times
- Poor Quality / Rework
Creating an Ideal and Future State Value Stream Map
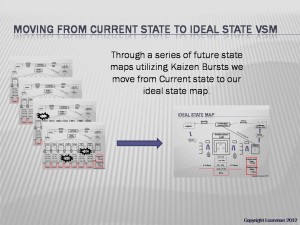
These problems highlighted above could all be tackled one by one; but what we really need is a vision of where we want to end up so that we can focus our efforts on achieving an agreed “Ideal State.” The team guided by the expert should create an ideal state value stream map which should envision the absolute best the process could be, this should then be agreed by senior management as the ultimate goal of your value stream mapping exercise. This Ideal state could be a single cell rather than isolated process silos in different parts of the factory with daily (or more frequent) deliveries to the customer and from the supplier. Kanban systems could be utilized to remove the need for planning and scheduling as well as many other ideas that could be considered.
Once you have your ideal state then you can plan to achieve your shared vision of where the process needs to be; the simplest way to do this is to plan a series of improvements, each taking two to three months, and use your value stream map to communicate what you want to do. Use the kaizen burst symbol on your current state map to highlight the improvements that you want to make, for instance reducing the setup time on the final test from 20 minutes to 5 minutes, your aspirations for your improvements become your future state value stream map. You may need several iterations of future state maps before you finally reach your ideal state.
If you have any questions about conducting value stream mapping (VSM) or creating a value stream map please leave them in the section below.

This is very good information.
This is the training thats better than higher education colleges.
Thank you for this information and education. This information is better than some higher education schools.
Thank you for explaining it details.
This is indeed very helpful.
Does anyone have experience in mapping primary production operations like a ranch? I am working on my first VSM and need some help/input. Thanks.
I just ran my first VSM session using this as a guide….very helpful!
Very much useful and practical guide, thanks for providing it. I am going to start VSM in my factory. I am expecting fruitful outcome.
Best of luck Rajiv, please let us know how you get on with your value stream mapping exercise.
Hello
My name is nishanth currently i am doing a internship in a company which produces laminates and they had given me task to improve the production process or otimization.I would like to start my assignment but i am unable to define it means from where should i start it ? i know the concepts but in practical i am unable to understand how to start the process ? Could you guide me?
Regrads,
Nishanth
Hi Nishanth,
Read through the information provided on the site as this will provide you with a good insight as to where you can start with your value stream map or if an alternative method would be more appropriate. Alternatively you can hire a consultant that has experience in this area and use their experience to support you. Providing support at a distance without an understanding of your process will require a considerable amount of time.
Newsletter requested
This will help for actual implementation
I am using a VSM to map report making and information streams at an airline. I have no opportunity to sit down with staff, all I am allowed to do is shadow supervisory staff in their work. I have experience with lean but it is my first time using a VSM for an information based process.
I can distinguish clients and suppliers of the process, but I’m wondering how I should treat incomplete information streams? Should this be seen as a defect or low quality? i.e. in 50% of cases information communicated is incomplete so the quality of that process is 50%?
Additionally report making is a definite Push process in this organization, much of the data gathered during the day is not relevant to higher management but is still recorded and passed on. In a future state map I would like to show that only relevant data, like anomalies, are passed on. The reason for passing on would then approach a Pull process. To this end, I want to classify irrelevant data as a defect or low quality.
I feel like I should make a distinction between incomplete data and irrelevant data. Incomplete data is a defect that should not be passed down the line, but I think classifying irrelevant data as a defect might be too rash.
I would like to know if you know of any examples of a VSM used in an information process and if you would be willing to share these? Anyway, thanks in advance for any help.
A VSM can be tailored to meet your specific needs and you do not have to use a specific defined version.
Defining incomplete data as 50% defective may cause people to dismiss the data as alarmist – unless of course this is causing significant delays in data processing. Think about what you want to achieve with your map and how people may perceive what you say.
Collecting and processing irrelevant data is a waste, maybe you can highlight how much waste is actually being produced in regards to time processing this information. Another way to consider it is to look at the processing time at each stage – what could it be on your future state map if the irrelevant data were removed?
You should also ask yourself why you cannot involve the people from the process in completing your map. Is this really a VSM exercise or does the “management” just want to identify the issues in the process and to streamline it? In which case a simple process map may be more appropriate for what they want. Sometimes simple and easy to understand is far better than something that may be unfamiliar and overly complicated.
What is the difference between Ideal state VSM and Future state VSM?
Hi Jeet;
The ideal state VSM is where you would like to get to if everything could be done perfectly. Often this is not achievable overnight as you would have to move entire factories around, change supplier relationships and a host of other things.
So each step change that you want to make would be represented by a future state map of where you want to get to with each project that you run. So there may be several future state maps that you work towards before you reach your ideal.
I have recently joined a confectionery industry and my first project is reduction of the existing workforce.
The industry caters to the unorganized sector and has machines which are only about 20-40% automated.
The main driving force of the company is its manpower.
Can VSM help me in reducing my workforce without having considerable effect on quality?
Can it by giving me tangible outcomes, comparing the present and proposed plan of action?
Or some other method would be more fruitful?
Thank you in advance.
Hi Krishn,
VSM on its own is not going to make a great reduction on the workforce. Most lean tools should use the workforce themselves to implement and you are not going to get much help if your aim is to get rid of the staff.
As a realist I do understand that at times a company will have to shed labor to survive and the use of simple process mapping and waste analysis can help you with this by identifying the non value adding steps in the process.
Hello LeanMan
I have got a project to develop VSM on train. For developing the VSM for a train , I identified 5 parts are essential Front, side, rear , cabin and roof. Each main part i.e front,rear etc also have many sub parts to be made. Now, when preparing a VSM for the main line, cycle time of the main part should be considered the assembly time of the main part to the train or the time taken to manufacture from the sub parts . Please clarify me what to take as cycle time and also
whether developing a VSM for the sub parts of the train do they give me an information on how to modify the future state map of the main line?
Hi Sathwick,
I will be honest I am not sure that I fully understand what exactly you are asking but I will try to answer as I think.
The cycle time should be the main process flow if that is what you are designing a VSM to improve.
As VSM for sub-assemblies will help you to improve the main flow also and identify if there are any issues that may impact the main line such as an inability to provide the volume that the main line requires or quality issues that may impact the main build.
Good quality, clear and concise information. Very good. I am starting to run VSM in an automotive supplier with two seperate customers who we supply to. One is approximately 100m from the plant, the other is 150miles. The two production lines are seperate and the flow runs in opposite direction (eek). Should I map them seperately and essentially plan a transformation plan for each?
Yes; Man of Lean,
I would map each line separately as they are distinct lines with different customers and I assume very different requirements.
Best of luck with your value stream map – let us know how well you get on and if you need any more help.
Hello LeanMan,
I have been asked to look into making VSM on “desk flows”, that is not physical flow of material in the factory, but more an administrative process. In this particular case it is an implementation process of new transport routes from supplier to factory.
My feeling is that the VSM methodology is more adapted to physical flows of material rather than desk flows.
But say that it’s possible, should you approach it in the same way? Of course you don’t have buffers and so on, but there is still lead times between the different steps in the process and a lot of information going back and forth. Maybe you could use an analogy where the information is equivalent to material/pallets.
Thank you in advance from Sweden.
Hi Jonas
Transforming paper or electronic based information can still be considered a manufacturing process, it has an input, a transforming process and an output. So yes you can approach it in much the same way. As to buffers; how big is your in-tray on your desk?
I led a team a while back that was looking at reducing the lead time taken for engineering changes that involved products and components that were already existing within the product line. This was on vehicle seating so the changes could be as simple as swapping the style of arm rests, or the color of the material being used. The existing system went through several internal sign offs and departments and often took up to 13 weeks to make a simple change in the paperwork etc. After just a few weeks we demonstrated a new system; the management team picked a new design using existing components at random and we provide all of the updated drawings, assy instructions, quality paper work and the actual product in just one hour. We used a very simple VSM to initially map the process and started chopping out everything that was there for the sake of bureaucracy and achieved no real value before looking at ways to to reduce processing and waiting times between processes. So yes a VSM can be used on any process.
The real value on using a VSM however is in being able to visualize that future state that you wish to reach; and then getting there.
Hello LeanMan
I have been asked to make a VSM regarding the dispatch process from the factory of my firm. Starting from truck entering the plant to truck leaving the plant. As it is a FMCG so there is no ‘make-to-order’ so I don’t have to consider the production of goods in the VSM. There are often idle times between some processes which is make difficult to calculate the cycle time of that process. Can it be like noting the time when actually the work is being performed and noting the time if a halt occurs in any situation then again noting the time when that particular work starts to calculate how much time the work was actualy performed as the cycle time. Is this practice fine or something else may be done.
Regarding Takt time, as there is a variation in the number of trucks that are dispatched everyday so how may be the Takt time calculated.
Kindly help me out. Thanking in advance.
Confused
Hi Confused,
I am also a little confused as to what you are specifically asking. Feel free to drop me an email through the “contact page” which is available in the right column and I will see if I can provide you some help with what you are trying to achieve with your VSM.
Hi,
I would first like to thank and congratulate you for the good quality of the article and the important information given about VSM.
I’m actually trying to make one and I find some difficulties.
I’m working on 3 families of products, each one passes through many units.
First, I’m having troubles with the Supplier part, I have too many suppliers, each with its own time of delivery, how can I illustrate it on the Map in a Mid-Detailed level. Same thing with customers (but I’m especially bothered with the supplier part)
Second Point : As I said, every family of products passes through many units, each unit with its own Raw Materials and machines and performance. Do I need to do a VSM for each unit or a “not-detailed-enough” Map with all the process (knowing that I need to focus on details) or both ?
Thank you very much for your interest
Hi Amine,
As with any VSM the answer is always going to be whatever gives you the information that you need to understand the process and visualize the improvements that you need to make. Think about what you actually want to know and draw your map accordingly.
If you need to present the information then maybe a “not detailed enough map – as you put it” showing the main areas of concern so that you can get buy in from management will be enough. But always ensure that you have to hand the other information that you may need.
Personally, without having a full idea of what you are mapping, I would probably start by selecting a single product or family and map that fully. Select the one that is the biggest value to the business and use that as your starting point. Whatever improvements you make for this product / family can then be transferred to the others. Trying to do and show everything is often just too much.
If you try to do everything at once then you are just going to bog yourself down in analysis and data gathering and will never start to get to the point of taking action.
If you want to have a more detailed discussion feel free to contact me directly.
Hi,
I am from IT SERVICES background and am going to start my first VSM to identify wastage in the process and planning eliminate it. I really find this article very informative and helpful. Thanks!
Good day, I am using VSM to represent SCRUM method, and I have a doubt about to represent the ceremonies (Spring Planning, Daily Stand Up, Review, Retrospective) in the VSM to produce software. I have heard about how to represent that ceremonies but I am not pretty sure how. If you could help me I appreciate. Regards.
Hi, I would like to know about the inventory triangle in VSM.
What does it means?
Excellent explanation of VSM. I have been involved with VSM’s before but only as a participant. No one has ever explained it in such clear detail and why each step is important – even the sub-steps.
This is, by far, the clearest explanation of VSM I have ever seen.
Well done
Hi
I would like to ask about tips constructing vsm for non manufacturing. I hope you can share some tips.
TQ
What’s the difference between processing time and lead time? Thank you in advance.
hiii, it’s amazing site. i’ve no more words to define your effort. at here, we can find the all tools of lean manufacturing as well as how to use to them.
Hi there,
I am wondering how the VSM represents steps in the process that overlap?
By this I mean for example a laboratory-environment where samples are received in bulk but are processed in smaller batches.
While sub-process 1 is still working on the received batch, sub-process 2 might start working on smaller batches that are available.
How do you represent this in the VSM-drawing (do you show overlap?) and what effect does this have on cycle-time of a sub-process?
Hi Alexander,
Would be helpful to have a little more detail. If you want feel free to contact me with what you have so far for your VSM through the contact page and I will see what advice I can offer you.
Hi there! I am currently working as an Intern in an Automotive supplier company. I am given a task to optimize the information flow between internal departments. At present, i am trying to collect as many details about what, why and how an information is transferred from one department/ person to the other, by using a research protocol which contains tables to collect the Information stream. I am really confused and helpless as for how to proceed further (The support from the management is also not good).
Initially, after I collect the information flow between departments, I have a plan to draw a detailed VSM to visualize the material and Information flow for a particular Product. The current state Map will actually show how the information is being transferred in each step and will display the bottleneck of the information as well as material, with which we can plan and change the mode of data transfer.
My question: is my decision to take VSM to find information distortion right? or is there some other method or steps that I can handle to proceed further.
*I have no prior Experiences with any Lean tool.
Hi Rammoghen,
Without seeing how complex the information is that you have collected it can be hard to give a definitive answer to your question. But from what you say a VSM could be one way to show where information is being held up if you show the workload that is at each stage in the process; maybe with a work in progress measure showing the number of documents with an average time for processing each.
Be careful when measuring processing time, maybe it only takes a few seconds to sign a piece of paper but they will often sit there for days before being reviewed. I would be inclined to take an average number of documents processed in a specific day to calculate a processing time.
I once did a similar process improvement on the flow of paperwork through a company; this was done as a “brown paper” exercise which took up a whole wall of a large meeting room to map out the flow. Despite showing major hold ups people were still resistant to change – that was until we turned the company CEO into a “document” and walked him step by step through the process, desk to desk, explaining how long he would sit on each desk etc. After the initial explosion and fall out things were soon improved. People were given responsibilities to approve work rather than sending multiple documents through many different departments and other issues.
Best of luck with what you are doing.
Thank you for the great explanation. I was wondering how does the Change over time influences the Total Lead Time calculation.
I am currently doing an internship in a transformer workshop. Where refurbishing of faulted transformers occurs. I have been handed an assignment to create a vsm for them. I would like to know how should i start and what kind of data i require.
Follow the Guidance provided on the pages here regarding how to create a VSM.
Hi, I just wanted know, how we will enter our data/time in a VSM? Either we will take the averages or will use the sum of all time consumed by all samples?
Dear Sir
I have been given a Project to do Value stream map a. Current State b. Future State c. Line Balance – start to end….for a corrugated paper manufacturing plant. I will appreciate it if I could link up with any persons who have done any similar exercise in the corrugated paper industry.
VSM is new to me …I am trying my best to learn as much as I can in a limited window period.
I would really appreciate any help or mentorship.
Kind regards
UB
Hello friends,
I am working on VSM in one of the casting industry. I have targetted to reduce the waste of excessive inventory but I have few issues like there is a sudden failure of casting machine. So as a safety stock, I need to maintain the inventory.
Do you have any idea about eliminating the waste of excess inventory?
Hi,
I’m doing an internship for a manufacturing company. I have to draw VSM for one product family and had a few questions with the current state. My apologies for any mistakes as English is not my first language. I had some lean classes in college so this assignment is really informative for me.
Some context: the company works per order, meaning at beginning of the day the first process receives all orders for that day. They finish their job for the order and the next process comes and takes it whenever they are ready (a lot of inventory inbetween processes, push system). So between processes there are always 4-5 orders inventory waiting if not more.
1. All deliveries from suppliers go to a big inventory building outside the factory (it’s about a minute away from factory). Inside the factory there is a second (smaller) inventory because it’s impossible to run outside for materials every order. Whenever the employee at the beginning of the process sees there are only a few materials left, he leaves to tell the main inventory building to refill. Should I draw this as two inventory triangles after each other, or is the main inventory building a process? I was thinking the main building is a process. I’m sure a lot of improvement in this step is possible.
2. I’ve already said they produce per order, this is giving me some difficulty to get accurate times for the data boxes. My VSM assignment is about one product yet orders are never just one product. I need to get process times for one product yet there is never an order with just the one product I require. To go into more detail: the first process I’m talking about is sawing. This means they saw everything required for the order yet the time I need is how long it takes to saw everything required for my one product.
Random example: they saw 5x 6 inches and 5x 8 inches and this is for two or three different products. Yet my one product I’m following would only require 2x 5 inches and 2x 8 inches. Ofcourse this is a simple example but in my case it’s more complicated products.
Thoughts?
Thanks you, looking forward to an answer.
Hi,
As my internship project I have to do a VSM of a excavator production line. In this there are many sub assemblies which are there. In the VSM how to add the sub assemblies and their respective time?
Thank you in advance